Non-alcoholic fatty liver disease (NAFLD) is the most common liver condition worldwide, affecting approximately one in four adults globally. For most people it remains stable, but in 20-30% of cases it progresses to non-alcoholic steatohepatitis (NASH) a state of active inflammation and hepatocellular injury that can advance to fibrosis, cirrhosis, and hepatocellular carcinoma. Understanding where a patient sits on this spectrum requires specific biomarkers at each stage, because the standard liver function tests used in clinical practice ALT and AST cannot reliably distinguish simple steatosis from steatohepatitis, or quantify fibrosis stage.
The NAFLD Spectrum: Five Distinct Disease States
NAFLD is an umbrella term covering a histological spectrum. The defining feature throughout is hepatic steatosis (>5% of hepatocytes containing lipid droplets) in the absence of significant alcohol consumption (<20g/day women, <30g/day men) and in the absence of secondary causes of fatty liver (medications, Wilson’s disease, total parenteral nutrition).
The five stages of the NAFLD spectrum are distinguished by the presence and degree of inflammation, hepatocyte injury (ballooning), and fibrosis none of which can be inferred from fat accumulation alone.
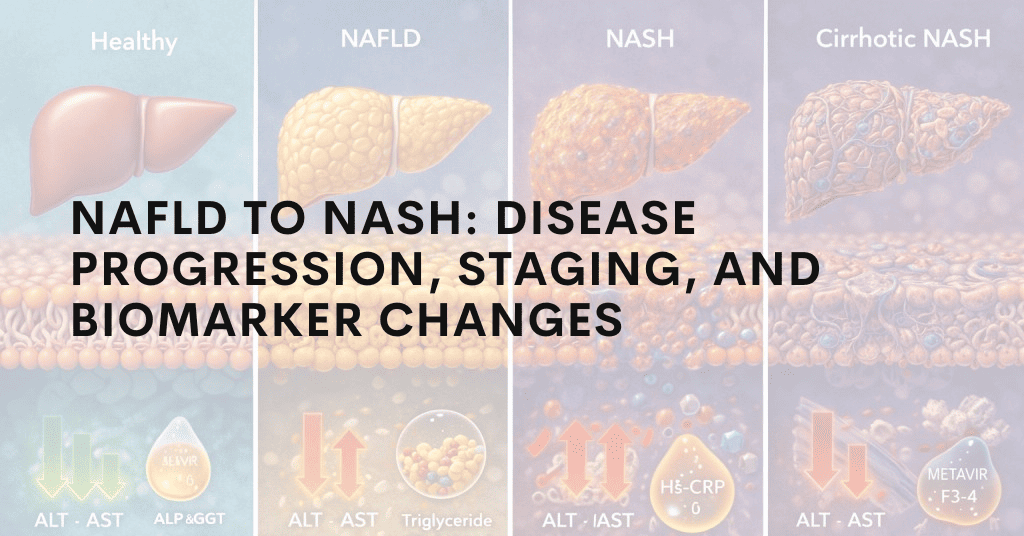
The NAFLD Disease Spectrum
Stage 1 – Simple Steatosis (NAFL): Fat accumulation (>5% hepatocytes), no inflammation, no fibrosis. Low risk of progression in isolation; prognosis driven by metabolic risk factors.
Stage 2 – NASH without Fibrosis (F0): Steatosis + lobular inflammation + hepatocyte ballooning. Histologically confirmed NASH. Active hepatocellular injury is occurring. Risk of fibrosis progression is significant.
Stage 3 – NASH with Early Fibrosis (F1�F2): Perisinusoidal or periportal fibrosis present. Stellate cell activation is underway. F2 represents bridging fibrosis beginning.
Stage 4 – Advanced Fibrosis (F3): Bridging fibrosis connecting portal tracts. Clinically significant risk of portal hypertension developing. Liver-related mortality risk rises substantially.
Stage 5 – Cirrhosis (F4): Architectural distortion, regenerative nodules, portal hypertension. Risk of hepatocellular carcinoma (HCC) independent of continued NASH activity.
The Pathogenic Mechanisms Driving NAFLD Progression
Understanding what drives the transition from simple steatosis to NASH requires understanding the “multiple parallel hits” model that has replaced the earlier “two-hit” hypothesis. NASH does not result from a single second insult on a background of fat it results from multiple simultaneous pathogenic processes operating in parallel.
Lipotoxicity
Simple steatosis involves the accumulation of triglycerides in hepatocytes a relatively inert storage form of lipid. The toxic species are not triglycerides themselves but the lipotoxic intermediates produced when triglyceride synthesis capacity is overwhelmed: free fatty acids (FFAs), diacylglycerol (DAG), ceramides, and lysophosphatidylcholine (LPC). These lipotoxic species activate intracellular stress pathways endoplasmic reticulum (ER) stress, mitochondrial dysfunction, oxidative stress and trigger hepatocyte apoptosis and necrosis. The degree of lipotoxicity, not the degree of steatosis, determines whether inflammation and injury occur. This is why some patients with mild steatosis can have active NASH, while others with severe steatosis remain in simple NAFL.
Kupffer Cell Activation and the Gut-Liver Axis
Hepatic macrophages Kupffer cells are the liver’s resident innate immune sentinels. In NASH, two converging signals activate Kupffer cells: lipotoxic intermediates released by stressed hepatocytes (activating TLR4 and inflammasome pathways), and pathogen-associated molecular patterns (PAMPs) translocated from the gut via the portal circulation. Dysbiosis of the gut microbiome consistently observed in NAFLD/NASH increases intestinal permeability, allowing bacterial lipopolysaccharide (LPS) to reach the liver in increased quantities. Kupffer cells recognise LPS via TLR4 and respond with a pro-inflammatory cytokine cascade: TNF-a, IL-1, IL-6. These cytokines amplify hepatocyte injury, recruit monocyte-derived macrophages from the circulation, and activate hepatic stellate cells.
Hepatic Stellate Cell Activation and Fibrogenesis
In the healthy liver, hepatic stellate cells (HSCs) reside in the space of Disse in a quiescent, lipid-storing state. When activated by TGF-1, PDGF, reactive oxygen species, and DAMPs released from injured hepatocytes, HSCs transdifferentiate into myofibroblasts the cells responsible for producing the fibrous collagen matrix that defines hepatic fibrosis. TGF-1 is the master fibrogenic cytokine: it drives HSC activation, upregulates collagen type I and III synthesis, and suppresses matrix metalloproteinase activity that would otherwise enable fibrosis resolution. Once significant fibrosis is established (F3-F4), it may persist even if NASH activity is suppressed.
Histological Staging Systems: NAS and Metavir
Two scoring systems are used to grade and stage NAFLD on liver biopsy. Understanding these is important for interpreting biomarker studies most published biomarker validation work reports sensitivity and specificity against biopsy-confirmed NASH using one of these systems.
The NAFLD Activity Score (NAS), developed by the NASH Clinical Research Network, grades three features: steatosis (0-3), lobular inflammation (0-3), and hepatocyte ballooning (0-2). A NAS =5 is associated with a diagnosis of NASH; NAS =2 is consistent with simple NAFL. NAS scores the activity of NASH it does not stage fibrosis. Fibrosis is staged separately on a 0-4 scale (F0 no fibrosis F4 cirrhosis).
The Metavir score, originally developed for viral hepatitis, is also applied in NAFLD it stages fibrosis on the same F0-F4 scale but grades inflammatory activity (A0-A3) rather than using the NAS components. Some clinical trials use Metavir fibrosis staging while others use the NAS fibrosis subscale.
Both systems require liver biopsy an invasive procedure with sampling variability. This is the core motivation for developing non-invasive serum biomarkers that can predict NAS score and fibrosis stage without biopsy.
Biomarker Changes Across the NAFLD Spectrum
Different biomarkers reflect different pathogenic processes and therefore change at different points in NAFLD progression. No single biomarker covers the full spectrum a panel approach is required for comprehensive staging.
ALT and AST Hepatocellular Injury Enzymes
ALT (alanine aminotransferase) is present predominantly in hepatocyte cytoplasm and is highly liver-specific. AST (aspartate aminotransferase) is present in both hepatocyte cytoplasm and mitochondria, and is less liver-specific (also present in muscle and heart). Both enzymes are released into circulation upon hepatocyte membrane disruption.
In simple steatosis, ALT may be mildly elevated (1-2 ULN) or remain within normal range lipid accumulation alone does not necessarily cause sufficient hepatocyte death to raise enzymes substantially. In NASH, ALT is typically elevated (1.5-4 ULN), reflecting active hepatocellular injury from lipotoxicity and inflammation. The key limitation: ALT and AST cannot distinguish NAFL from NASH approximately 20-30% of biopsy-confirmed NASH patients have normal ALT, and ALT elevation is not specific to NASH activity.
The AST:ALT ratio provides additional staging information. A ratio <1 is typical of NAFLD; a ratio >1 (and especially >2) suggests more advanced disease alcoholic hepatitis or cirrhosis as mitochondrial AST is released as hepatocyte architecture deteriorates. In cirrhosis, ALT may paradoxically fall as functional hepatocyte mass is lost.
| Biomarker | Simple Steatosis | NASH (F0) | Fibrosis F1-F2 | Advanced F3-F4 | Cirrhosis |
|---|---|---|---|---|---|
| ALT | Normal or mildly | (1.5-4-ULN) | May normalise or fall | ||
| AST | Normal or mildly | AST:ALT >1 | AST:ALT >2 | ||
| Albumin | Normal | Normal | Normal | Low-normal | Decreased (<35 g/L) |
| CK-18 (total) | Normal | (key NASH marker) | Variable | ||
| TGF-1 | Normal or mildly | ||||
| FGF-21 | Variable | ||||
| Adiponectin | |||||
| TNF-a | Normal or mildly | (Kupffer cells) | Elevated |
CK-18 The NASH-Specific Apoptosis Marker
Cytokeratin-18 (CK-18) is an intermediate filament protein present in hepatocyte cytoskeleton. During apoptosis, caspases (particularly caspase-3 and caspase-7) cleave CK-18 at specific sites, generating fragment epitopes detectable by specific antibodies: the M30 epitope (caspase-cleaved, apoptosis-specific) and the M65 epitope (total CK-18, detectable in both apoptosis and necrosis). Full-length CK-18 is also released during necrosis.
The biological logic for CK-18 as a NASH biomarker is direct: apoptosis of hepatocytes is a defining feature of NASH histology (hepatocyte ballooning the histological hallmark is in part a morphological manifestation of pre-apoptotic cellular changes), and is a key component of NAS scoring. Simple steatosis involves minimal hepatocyte apoptosis; NASH involves substantially elevated apoptosis rates. A meta-analysis of 9 studies (n=649 patients) found that total CK-18 (M65) had an AUROC of 0.82 for diagnosing NASH vs non-NASH NAFLD superior to ALT, AST, BMI, or any other single non-invasive test.
The M30:M65 ratio provides an apoptosis:necrosis balance index. A high M30:M65 ratio (predominantly apoptotic death) is typical of early/moderate NASH; a low ratio (increasing necrosis contribution) may indicate more severe disease. The clinical significance of this ratio is still being characterised in longitudinal studies.
TGF-1 The Fibrogenesis Marker
Transforming growth factor beta 1 (TGF-1) is a pleiotropic cytokine that serves as the master regulator of hepatic fibrogenesis. It is produced by Kupffer cells, activated stellate cells, and injured hepatocytes, and acts on hepatic stellate cells via TGF- receptor I/II ? SMAD2/3 signalling to drive myofibroblast transdifferentiation, collagen synthesis, and matrix remodelling.
In the NAFLD spectrum, TGF-1 is relatively uninformative in early disease (simple steatosis with no stellate cell activation) but rises progressively with fibrosis stage. TGF-1 is particularly elevated in F3-F4 advanced fibrosis, making it a useful marker for identifying patients with clinically significant fibrosis. Several anti-fibrotic drugs in clinical development for NASH (including TGF-receptor inhibitors and anti-LOXL2 agents) use circulating TGF-1 as both a patient selection biomarker and a pharmacodynamic endpoint.
Important practical note for ELISA measurement: TGF-1 circulates predominantly in a biologically inactive latent form, complexed with latency-associated peptide (LAP) and latent TGF- binding proteins (LTBPs). Standard ELISA without prior activation steps will measure only the small free active fraction substantially underestimating total TGF-1. Acid activation (1N HCl, 10 minutes, then neutralisation) dissociates the latent complex and enables measurement of total TGF-1. Research studies reporting TGF-1 data should specify whether total or active TGF-1 was measured.
FGF-21 � Hepatic Metabolic Stress Marker
Fibroblast growth factor 21 (FGF-21) is a hepatokine a hormone secreted by the liver produced in response to fasting, carbohydrate excess, and fatty acid overload via PPARa activation. It acts on adipose tissue (via FGFR1c/KLB co-receptor) to promote thermogenesis and adipose browning, and on the hypothalamus to suppress appetite.
In the context of NAFLD/NASH, FGF-21 rises as a homeostatic response to hepatic lipid stress the liver increases FGF-21 output in an attempt to promote lipid clearance through adipose tissue. The degree of FGF-21 elevation therefore reflects the degree of hepatic metabolic stress. Multiple cross-sectional studies have shown FGF-21 to be elevated 2-3-fold in NAFLD and 4-5-fold in NASH compared to healthy controls, with further elevation in advanced fibrosis.
FGF-21 has an additional layer of significance: it is now itself a therapeutic target. FGF-21 analogs (pegozafermin, efruxifermin) are in Phase III NASH trials, and the next generation of GLP-1-based combination therapies includes GLP-1/GIP/FGF-21 triple agonists. In these trials, circulating FGF-21 may serve simultaneously as a biomarker of disease severity, a pharmacodynamic marker of drug effect, and a comparator endpoint between different therapeutic mechanisms.
Adiponectin The Hepatoprotective Adipokine
Adiponectin is an adipokine secreted by healthy, small-diameter adipocytes. It is inversely correlated with adiposity levels fall progressively as fat mass increases and adipose tissue becomes dysfunctional. In the liver, adiponectin signals via AdipoR1 and AdipoR2 to activate AMPK, promote fatty acid oxidation, suppress gluconeogenesis, and exert anti-inflammatory effects on Kupffer cells (suppressing NF-B activation and TNF-a production).
Adiponectin is reduced throughout the NAFLD spectrum the reduction beginning at the stage of metabolic syndrome and obesity that precedes hepatic fat accumulation. It does not dramatically further change across NAFLD stages, but its absolute level is consistently lower in NASH vs simple NAFL, and lower still in advanced fibrosis. The most important practical application of adiponectin measurement in NAFLD research is as part of a metabolic risk stratification panel particularly the Adiponectin:Leptin (A/L) ratio, where A/L <1.0 is associated with insulin resistance, and very low adiponectin (<4 g/mL) is an independent risk factor for NASH development.
Why Liver Biopsy Remains the Gold Standard and Its Limitations
Despite the advances in non-invasive biomarkers described above, percutaneous liver biopsy remains the regulatory and scientific gold standard for NASH diagnosis and fibrosis staging. This is because no current serum biomarker or imaging technique can replicate the histological information available from biopsy: the combination of steatosis grade, lobular inflammation, hepatocyte ballooning, and precise fibrosis stage that constitutes the NAS score.
However, biopsy has important limitations. It carries procedural risks (bleeding, pain, rare but serious complications). It samples only 1/50,000th of liver volume, introducing sampling variability studies have shown that two biopsies taken simultaneously from different sites in the same liver can disagree on fibrosis stage by one or more grades in 20 – 30% of cases. It is impractical for large-scale screening, serial monitoring, or population studies. And it is unacceptable to many patients.
These limitations have driven substantial investment in non-invasive NASH biomarker development. The ideal non-invasive biomarker panel would accurately distinguish NAFL from NASH (avoiding unnecessary biopsy in low-risk patients), stage fibrosis (identifying the clinically important F3 – F4 threshold), and serve as a treatment response endpoint in clinical trials. No single biomarker achieves all three objectives but combination panels incorporating CK-18, TGF-1, FGF-21, ALT, and adiponectin come closer than any individual marker.
Non-Invasive Scoring Systems Using Biomarkers
Several non-invasive scoring algorithms have been developed and validated to predict NASH or fibrosis stage from serum biomarkers and clinical variables, reducing the need for biopsy in lower-risk patients.
The FIB-4 Index (Age AST / Platelet count vALT) is the most widely adopted clinical tool for excluding advanced fibrosis a FIB-4 <1.30 has a negative predictive value of approximately 90% for advanced fibrosis (F3-F4) in most NAFLD populations. It uses only routine clinical chemistry values and requires no specialised assay.
The NAFLD Fibrosis Score (NFS) incorporates age, BMI, impaired fasting glucose/diabetes status, AST/ALT ratio, platelet count, and albumin. An NFS <-1.455 suggests no advanced fibrosis with high sensitivity; NFS >0.676 suggests advanced fibrosis with high specificity. NFS performs similarly to FIB-4 and is used interchangeably in most guidelines.
The Enhanced Liver Fibrosis (ELF) Panel a commercial assay measuring hyaluronic acid, PIIINP (pro-collagen III N-terminal peptide), and TIMP-1 is a direct matrix biomarker test that stages fibrosis. It is approved by EMA and used in European clinical practice guidelines (EASL-EASD-EASO) as a second-line non-invasive fibrosis test. It performs better than FIB-4 at intermediate fibrosis stages but requires a specialised assay.
Research-grade panels incorporating CK-18, TGF-1, FGF-21, and adiponectin alongside clinical variables have shown AUROC values of 0.85 – 0.92 for distinguishing NASH from simple NAFL in published studies but these panels are not yet widely adopted in clinical practice due to lack of standardisation and regulatory approval as diagnostic tests.
NASH in the Context of GLP-1 Agonist Therapy
The NAFLD/NASH field has been substantially energised by the clinical activity of GLP-1 receptor agonists particularly Semaglutide and Tirzepatide in improving hepatic steatosis and steatohepatitis. Phase II trials of Semaglutide in NASH (PILLAR trial) demonstrated NASH resolution in 59% of the Semaglutide 0.4 mg/day group vs 17% placebo at 72 weeks. Tirzepatide is currently in Phase III NASH trials (SYNERGY-NASH).
These trials have elevated the importance of the biomarker panel discussed in this article. Researchers conducting GLP-1 mechanism-of-action studies or monitoring NASH treatment responses need to measure:
Drug exposure (to confirm adequate pharmacokinetics in each patient using Semaglutide ELISA or Tirzepatide ELISA); NASH activity markers (CK-18 to track apoptosis reduction, ALT/AST for injury); fibrogenesis markers (TGF-1 for stellate cell activity); hepatic metabolic stress (FGF-21, which should fall as hepatic fat is cleared); and metabolic response (adiponectin, which should rise with GLP-1 agonist therapy as adipose tissue function improves).
The combination of drug PK quantification alongside this hepatic biomarker panel represents the current state of the art in GLP-1 NASH pharmacodynamic study design.
